Supervised ML
Contents
11.2. Supervised ML#
Machine learning is generally divided into three broad types: supervised machine learning, unsupervised machine learning, and reinforcement learning. The very broad, high-level distinctions between the three are:
Supervised ML: we have labelled data, meaning both input and output data, and our algorithm predicts outputs for new input data we provide
Unsupervised ML: we have unlabelled data, meaning only input data, and our algorithm partitions or simplifies our data into (hopefully) useful clusters for us to make inferences about
Reinforcement learning: inputs are given, and then the algorithm is “rewarded” or “punished” based on output
In this section we’ll talk in more detail about the key features and types of supervised machine learning. In the next section we’ll turn to unsupervised machine learning, and reinforcement learning will come in the next chapter on frontiers in data science.
A closer look#
We use supervised machine learning when we have labelled data, meaning we have both input (X) and output (y) variables. In supervised ML, we train a model on the relationship between our X’s and y, then we test the quality of our model with our test set, and then we make predictions about new input, or X, variables.
The two main types of supervised machine learning are regression and classification, both of which we’ve done in previous chapters. Indeed, if you go back to all the examples in the prediction chapters, the cases we considered had both input variables (e.g., data from bloodwork, financial transactions, or features of an apartment) and output variables (e.g., the presence of CKD, whether or not a transaction was fraudulent, the price of an apartment). When we have both our X and our y, and we want to predict new y labels or values given new X values, we are doing supervised ML.
Supervised learning with one input variable and one output variable#
For a high-level visualization of supervised machine learning, consider the image below. Each column represents a variable in a bivariate, or simple, linear regression, with the input variable on the left and output on the right. The example in the visualization is our cigarette tax example from an earlier chapter. So, in this case, our input variable, or IV, or attribute, etc., is the cigarette tax in a state, and the output variable, or DV, or result is the smoking rate in that state.
The data in blue is the data in our original dataset. As we saw in the previous chapters, in supervised ML we divide our dataset into training and test sets. In the example below, we set our test set to 20%, leaving our training set as 80%. We then train our model on the data. To see how well our model does, we then provide our newly-trained model with our test input data, generate predictions, and then compare those predictions to our actual output data. Once we are satisfied with our model’s accuracy, we then are ready to provide new input data to our model and make our predictions for the future.

Fig. 11.1 Visualization of supervised simple (or bivariate) linear regression#
If this were a supervised classification model, the process would be very similar, with the one big change that the output variable is a category (or class, or label) rather than a numeric value. Of course, the underlying machine learning algorithm would also be a classifier. As we saw in the previous chapter, we can use classifiers like \(k\)-NN for continuous output variables as well, of course. The image below is a visualization of the components of our analysis for the classification problem of predicting whether a transaction is fraudulent or not. If we are predicting a label that can take on two classes (often, yes or no) we are conducting binary classification. If we are predicting a label that can take on one of three or more classes, we are conducting multiclass classification (for example if we are predicting the political party of voters, and a voter could be one of democrat, republican, or independent).

Fig. 11.2 Visualization of supervised classification#
Supervised learning with more than one input variable and one output variable#
Of course, with both regression and classification we can have more than one input variable. In regression, this is multiple linear regression. The visualization below depicts our same linear regression on smoking rates as above, but this time with three rather than just one input variable.
Multiple linear regresion is not the same thing as multivariate linear regression, which is when we have more than one dependent variable. As you continue on your data science journey, you’ll likely come across this type of regression as well, and you’ll likely come across people confusing these two terms out in the world. In the meantime we want to make sure it’s clear that we are doing multiple linear regression when there is more than one IV and one DV, as depicted below.

Fig. 11.3 Visualization of supervised multiple linear regression#
We can also have multiple attributes for our classification algorithm as well. We saw an example of this when we considered \(k\)-NN in three dimensions. In the visualization below, we have a dataset with three attributes and one outcome label. Of course, we can conduct \(k\)-NN in far more dimensions than just three. We feeble humans can’t really effectively visualize more than three dimensions, but computers are excellent at calculating distances in many, many dimensions. (Though as you continue in data science you’ll also learn more about the “curse of dimensionality”, which is that many algorithms do perform worse as dimensionality increases, but we’ll leave that point here for now! Perhaps for now you can just remember: there’s no such thing as free dimensionality!)
And to add on some more terminology specifics: In the below visualization, we are still conducting a binary classification because we are predicting a label that can take on one of two classes (fraud or no fraud). We don’t have a separate word for classification with multiple attributes like we do for multiple regression. But, do note that you will come across a term “multi-label classification” which is when we are predicting more than one nonexclusive label to each observation. But, as with multivariate regression, you can mostly set that aside for now, but we want you to know it’s not the same thing should you come across it.)
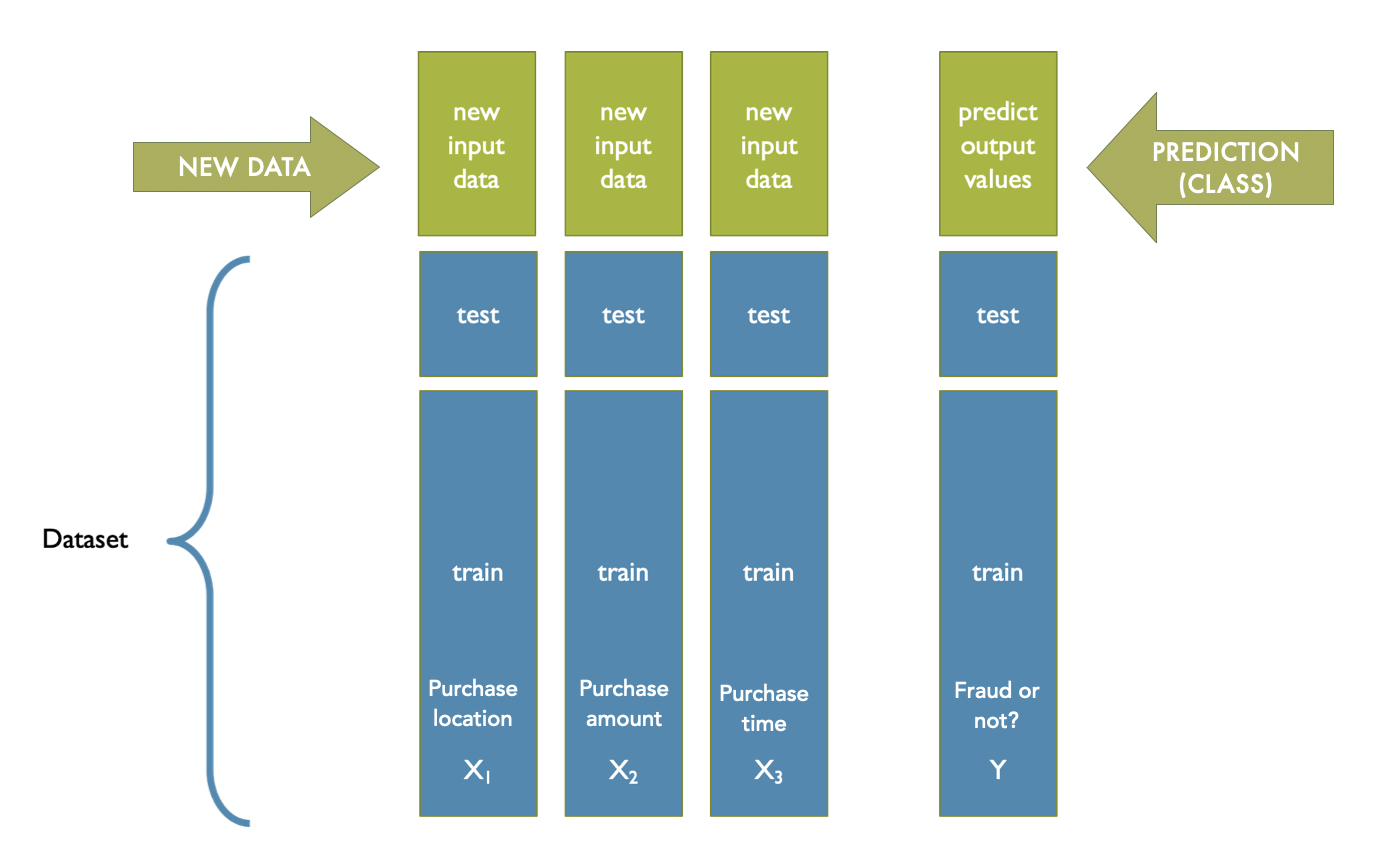
Fig. 11.4 Visualization of supervised multiple linear regression#