Testing hypotheses: Swain vs. Alabama
Contents
4.4. Testing hypotheses: Swain vs. Alabama#
Consider the following research questions:
Is global warming responsible for forest fires?
Does circumcision reduce HIV risk?
Did austerity cause Brexit?
Does breastfeeding increase IQ?
Some of these questions are amenable to randomized control trials, but some are not. But whether we can do an RCT or not, we need a model for the data generating process (DGP). The DGP is
the set of assumptions about the chance processes that gave us the data we actually saw in the world.
A simple example of a DGP is the assumptions that human heights follow a particular distribution (e.g. are normally distributed). But one can make many other assumptions.
A model is
a simplified version of reality that helps us link hypothesis to experiments or to observational data
The model tells us how to think about the “important” aspects of the data generating process. For example, a simple model of why people vote the way they do is that they work out which party will leave them better off financially, and vote for it. Like all models, this is wrong insofar as it doesn’t completely explain why everyone votes the way they do. But it is helpful in part because it may have some predictive power, and because it may tell us what types of hypotheses to test. For example, that model might tell us to test the hypothesis that richer people vote for the party that wants lower taxes.
Swain v Alabama#
To get a sense of these ideas, we begin with a legal example. Robert Swain was a Black man on trial in Talladega County, Alabama in 1965. The 12 person jury allocated to the case was all white; this was despite the fact that approximately 26% of the local population eligible to serve was Black. Indeed, in this particular county, not a single Black person had served on a trial jury since 1950. Juries in the county were selected from panels of 100 people. On Swain’s panel, only 8 people (so, 8%) were Black.
Swain appealed his conviction to the Supreme Court on the basis that Black jurors had been deliberately excluded (“struck”), and thus he had not had a fair trial violating his 14th Amendment rights.
The task before the Supreme Court was to decide whether there was in fact evidence of systematic exclusion of Black people from juries by the county. Ultimately the court ruled against Swain; it acknowledged the nature of his panel, but argued that “the overall percentage disparity has been small and reflects no studied attempt” by the county to exclude based on race. Furthermore, unless Swain could demonstrate that the attempts were systematic, he could not show his trial was unfair. Ultimately, a later case—Batson v Kentucky—lead to the Supreme Court ruling that excluding only based on the race of a potential juror was not legal. But this was too late for Swain.
A model of jury panels#
How plausible is it that there was “no studied attempt” to exclude Black people from serving on juries? That is, what model of the world is consistent with the Supreme Court’s judgment. We can simplify by focusing on the panel. To recap, this had 100 members, of which 8 were Black. Our central question is:
if the panel was picked at random from citizens (26% Black), how likely is it that it would contain (only) 8 Black men?
We will be more precise below, but for now:
if the answer to this question is “pretty likely”, then the Supreme Court judgment is reasonable
if the answer to this question is “pretty unlikely”, then the Supreme Court judgment is unreasonable.
A Simulation Study#
We will investigate this question via simulation. In particular, based on what we know about the county, we will draw many jury panels and see how many of them looked like the one Swain received. If this number is small, then we have evidence consistent with systematic discrimination.
More precisely:
we will simulate the drawing of 100 jurors from the county, where 26% of the population in Black.
This simulation will show us what the panels would have looked like assuming the Supreme Court’s “model” was correct—i.e. if panels are indeed simply randomly drawn from the surrounding area, with no account for race.
We will compare that simulation “model” outcome to the actual outcome experienced by Swain (8 Black jurors)
If the model outcome looks very different to Swain’s actual, empirical outcome, we can conclude the model is a poor one: Swain’s outcome was not due to random chance. If the model outcome looks very similar to Swain’s outcome, we can conclude the model is a good one: Swain’s outcome was due to random chance.
Statistic Under The Model#
What statistic shall we calculate and inspect? Presumably, it is the number of Black people in our jury panel simulations. There are two broad possibilities:
this statistic is small (so, 8 or smaller), which means Swain’s outcome is consistent with random selection, and the Supreme Court is right or
this statistic is not so small (so, more than 8), which means Swain’s outcome is not consistent with random selection, and the Supreme Court is wrong.
Notice the idea of a binary decision: either we find evidence in line with the model, or we don’t, and we reject it. We will return to this reasoning structure in more detail below.
Simulations#
In words, we need to:
draw 100 people from a distribution where the underlying proportions are 26% Black, and 74% non-Black
study each 100 person draw; the number of Black people will differ slightly, randomly, with each draw: it might be 10, then 5, then 21 etc. We record these numbers.
repeat steps 1. and 2. a very large number of times. This will enable us to build up an empirical distribution of the counts.
Let’s begin with 10 draws (of 100 people each). Here is the resulting distribution (in blue):
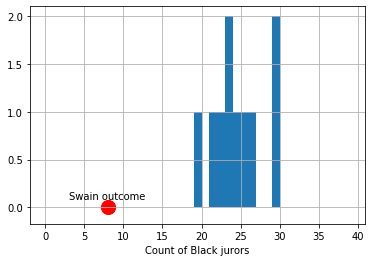
Fig. 4.14 10 draws of 100 people each from the population#
The observed outcome in Swain’s case is the red dot (at the count of 8). Let’s increase the number of simulations to 1,000:

Fig. 4.15 1000 draws of 100 people each from the population#
And finally to 100,000:

Fig. 4.16 100,000 draws of 100 people each from the population#
To reiterate, the distribution in blue is what the “random” model says are the possible outcomes—in terms of counts of Black jurors—for this data generating process. As we can see, this is always very far from the actual outcome Swain received. Put differently, it is not very plausible that Swain’s outcome is consistent with a no systematic discrimination model jury selections.
More formally, we say we have evidence to “reject” the hypothesis of random selection. And we have evidence consistent with an “alternative” hypothesis of discrimination. We will return to such ideas in some detail below.
Analytical Probability#
In practice, none of the histograms above overlap with the Swain outcome. This means that there was never a single simulation draw which had 8 Black people (or fewer). Taken literally, this implies that the probability of 8 Black people or fewer is zero. But this is not true: it is in principle possible that we could select a panel with that number. Indeed, we could select a panel with 0 Black people or 0 non-Black people or any combination in between. But it is a very rare event.
How rare is this event? That is, what is the exact probability of drawing 8 or fewer Black people based on the demographic background of the county? Assuming independent draws from the population, and a binomial DGP (meaning there are two categories of outcomes), the probability is around 0.000047. Or around \(\frac{1}{212,000}\).
To see a model distribution that overlaps with Swain’s outcome, we would (probably) need to do many more simulations. Even with say, one million, it is not guaranteed that our model distribution would overlap (feel free to experiment, but it might take a while!).